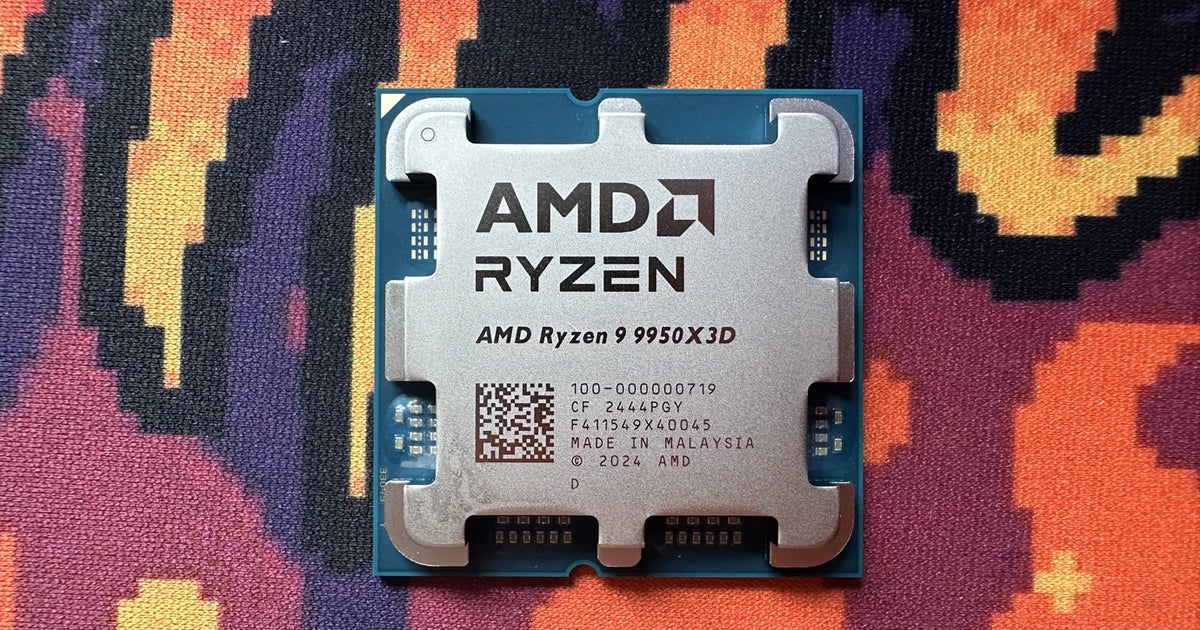
The story of the AMD Ryzen 9 9950X3D is refreshingly straightforward: it is as fast as the excellent Ryzen 7 9800X3D in games, more or less, but has double the cores, so it’s significantly better in content creation scenarios like 3D modelling or video transcoding where all available threads are used. If you want a single CPU that can do it all, this is the one to get – though it costs a hefty £659 in the UK and $699 in the US.
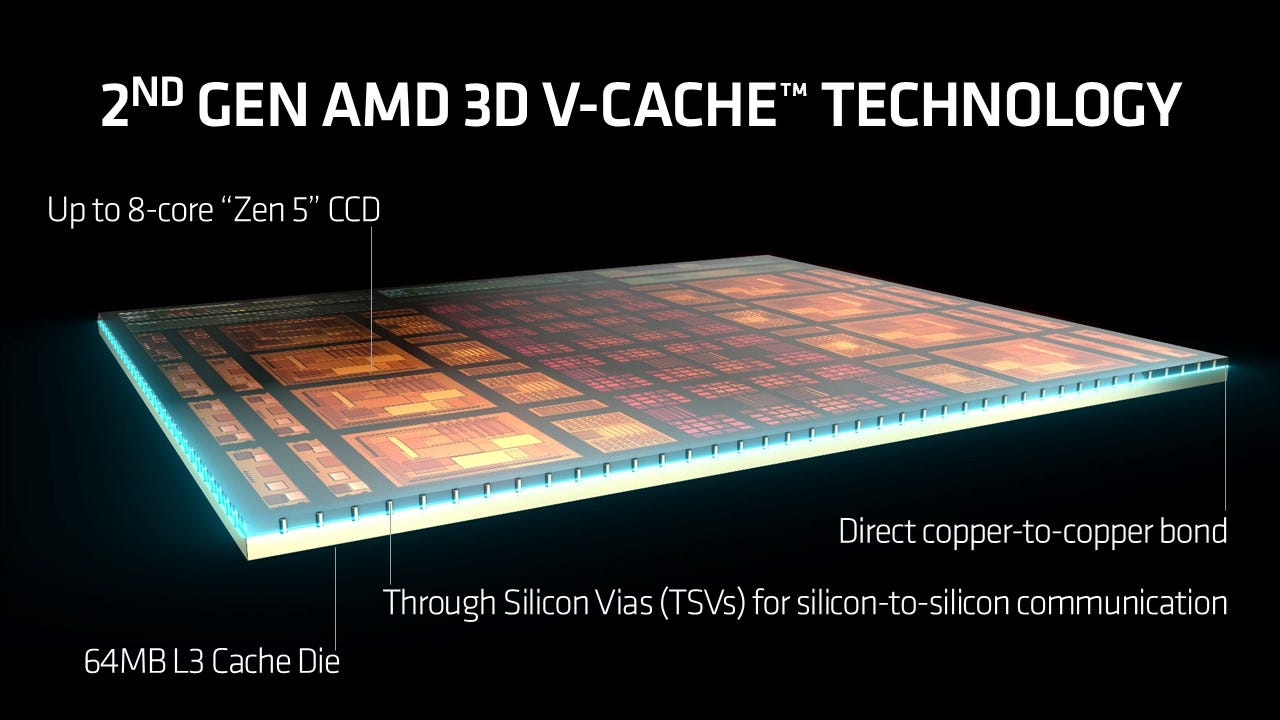
Like the 9800X3D that arrived late in 2024, the 9950X3D has a much larger L3 cache compared to a standard Ryzen 9000 processor, located underneath the CCD rather than above it as we saw on previous Ryzen X3D designs. That means we get that game-changing performance advantage without the hit to temperatures and clock speeds that previously characterised X3D processors versus their vanilla counterparts; the best of both worlds.
To properly get to grips with the level of performance on offer, we’ve run the 9950X3D through our full gamut of 11 game benchmarks at 1080p, 1440p and 4K, including some of the most demanding single-player (Dragon’s Dogma, Starfield, Cyberpunk) and multiplayer (CS2, F1 24) releases.
Before we get into all that though, it’s worth taking a closer look at the specs here to get an idea of the sort of performance we can expect in content creation workloads.
In short, the 9950X3D is extremely promising for content creation, as it has the same rated boost and base clockspeeds and TDP versus the 9950X, with a straight doubling of L3 cache. That ought to mean that it should roughly match the 9950X in standard workloads or even pull beyond it, even if that 3D V-Cache consumes a bit of extra power and produces a bit of extra heat. That’s quite a departure from even the Ryzen 7000 X3D chips, where reduced clockspeeds and higher temperatures resulted in a small net performance regression in all-core workloads.
It’s also worth noting that this is the most expensive Ryzen processor ever, with its $699 price point coming in more than $100 above the 9950X and the 7950X3D. The graphics card market has seen an epidemic of models selling far above MSRP, but hopefully we won’t see a similar trend for CPUs which don’t use the “board partner” model.
| CPU design | Boost | Base | L3 cache | TDP | Price | |
|---|---|---|---|---|---|---|
| Ryzen 9 9950X3D | Zen 5 16C/32T | 5.7GHz | 4.3GHz | 128MB | 170W | £659/$699 |
| Ryzen 9 9950X | Zen 5 16C/32T | 5.7GHz | 4.3GHz | 64MB | 170W | £555/$584 |
| Ryzen 9 9900X3D | Zen 5 12C/24T | 5.5GHz | 4.4GHz | 128MB | 120W | £TBA/$599 |
| Ryzen 9 9900X | Zen 5 12C/24T | 5.6GHz | 4.4GHz | 64MB | 120W | £383/$383 |
| Ryzen 7 9800X3D | Zen 5 8C/16T | 5.2GHz | 4.7GHz | 96MB | 120W | £449/$479 |
| Ryzen 7 9700X | Zen 5 8C/16T | 5.5GHz | 3.8GHz | 32MB | 65W | £309/$324 |
| Ryzen 5 9600X | Zen 5 6C/12T | 5.4GHz | 3.9GHz | 32MB | 65W | £229/$249 |
| Ryzen 9 7950X3D | Zen 4 16C/32T | 5.7GHz | 4.2GHz | 128MB | 120W | £550/$595 |
| Ryzen 9 7950X | Zen 4 16C/32T | 5.7GHz | 4.5GHz | 64MB | 170W | £429/$487 |
| Ryzen 9 7900X3D | Zen 4 12C/24T | 5.6GHz | 4.4GHz | 128MB | 120W | £443/$569 |
| Ryzen 9 7900X | Zen 4 12C/24T | 5.6GHz | 4.7GHz | 64MB | 170W | £323/$395 |
| Ryzen 7 7800X3D | Zen 4 8C/16T | 5.0GHz | 4.2GHz | 96MB | 120W | £398/$476 |
| Ryzen 7 7700X | Zen 4 8C/16T | 5.4GHz | 4.5GHz | 32MB | 105W | £264/$269 |
| Ryzen 5 7600X | Zen 4 6C/12T | 5.3GHz | 4.7GHz | 32MB | 105W | £189/$207 |
| Ryzen 5 7600 | Zen 4 6C/12T | 5.1GHz | 3.8GHz | 32MB | 65W | £167/$198 |

All testing was performed on Windows 24H2 with the latest chipset drivers (7.01.07.634) and BIOS updates installed (3.20 on our ASRock X670E Taichi). We’re using Nvidia’s slightly older 565.90 graphic drivers installed in order to maintain continuity with past results, as our test suite doesn’t include any games that require newer drivers. Resizable BAR and core isolation were enabled on each system.
Our current CPU test platform is based around the Nvidia GeForce Nvidia GeForce RTX 4090 Founders Edition graphics card and Trident Z5 Neo DDR5-6000 CL30 RAM. Each CPU is accompanied by a 1000W+ power supply from Corsair or NZXT, a high-end 240mm or 360mm AiO and a suitable premium motherboard: the ASRock X670E Taichi for AMD Ryzen 7000 and 9000, the MSI Z890 Meg Ace for Intel Core Ultra 200S, the Gigabyte Aorus Z790 Master for 12th and 14th-gen Intel Core and the Asus ROG Crosshair 8 Hero for AMD Ryzen 5000 – with Trident Z Royal DDR4-3600 CL16 as DDR5 RAM is not supported on this platform.
Storage duties are handled by a range of PCIe 4.0 or PCIe 5.0 SSDs, including the WD SN5000 4TB NVMe SSD for our AMD Ryzen 9000 system.
Now, let’s move onto the content creation benchmarks to get a better sense of how the 9950X3D builds on its predecessors. After all, for pure gaming purposes the 9800X3D is likely to be completely sufficient, so if you’ve chosen the 9950X3D you’ll hopefully be using that extra cores for something like video production or 3D modelling.
| Cinebench | 2024 (1T) | 2024 (MT) | R20 (1T) | R20 (MT) |
|---|---|---|---|---|
| Ryzen 5 3600X | 77 | 578 | 485 | 3654 |
| Ryzen 7 5800X3D | 95 | 915 | 546 | 5746 |
| Ryzen 9 5900X | 98 | 1171 | 610 | 8393 |
| Ryzen 5 7600X | 114 | 845 | 744 | 5814 |
| Ryzen 7 7700X | 118 | 1127 | 758 | 7609 |
| Ryzen 7 7800X3D | 112 | 1074 | 688 | 6988 |
| Ryzen 9 7900X | 116 | 1605 | 776 | 11196 |
| Ryzen 9 7950X | 121 | 2004 | 784 | 14272 |
| Ryzen 5 9600X | 132 | 935 | 850 | 6358 |
| Ryzen 7 9700X | 130 | 1172 | 862 | 7851 |
| Ryzen 9 9800X3D | 134 | 1342 | 823 | 8938 |
| Ryzen 9 9900X | 135 | 1784 | 879 | 12617 |
| Ryzen 9 9950X | 138 | 2237 | 881 | 15845 |
| Ryzen 9 9950X3D | 139 | 2343 | 881 | 16343 |
| Core i5 14600K | 120 | 1400 | 777 | 9420 |
| Core i7 14700K | 127 | 1987 | 818 | 13614 |
| Core i9 14900K | 133 | 2107 | 875 | 15297 |
| Ultra 5 245K | 128 | 1435 | 841 | 9864 |
| Ultra 9 285K | 144 | 2386 | 895 | 16055 |
Starting with our Cinebench test results, including the popular R20 and more recent 2024 release, the 9950X3D actually shows better results than the 9950X by a small margin – it’s around five percent faster in CB 2024 multi-core and three percent faster in CB R20’s multi-core test. Amazingly, that means it now holds the overall record in R20, coming just ahead of the Core Ultra 285K, while coming just behind the same processor in Cinebench 2024.
Versus the previous generation 7950X, there’s also a nice lead – around 15 percent in single-core and 17 percent in multi-core for CB 2024. The differentials in Cinebench R20 are slightly narrower, with a 12 percent single-core lead and 15 percent multi-core advantage.
| Handbrake | H264 (fps) | HEVC (fps) |
|---|---|---|
| Ryzen 5 3600X | 26.66 | 10.80 |
| Ryzen 7 5800X3D | 42.00 | 18.71 |
| Ryzen 9 5900X | 57.59 | 23.83 |
| Ryzen 5 7600X | 41.29 | 18.31 |
| Ryzen 7 7700X | 53.27 | 23.65 |
| Ryzen 7 7800X3D | 49.63 | 21.54 |
| Ryzen 9 7900X | 78.35 | 32.59 |
| Ryzen 9 7950X | 98.58 | 41.68 |
| Ryzen 5 9600X | 42.51 | 19.77 |
| Ryzen 7 9700X (191W max) | 51.80 | 23.79 |
| Ryzen 7 9800X3D (259W max) | 59.59 | 27.44 |
| Ryzen 9 9900X | 82.96 | 35.33 |
| Ryzen 9 9950X (363W max) | 105.43 | 45.35 |
| Ryzen 9 9950X3D (403W max) | 109.24 | 46.40 |
| Intel Core i5 14600K | 59.42 | 25.39 |
| Intel Core i7 14700K | 80.26 | 31.07 |
| Intel Core i9 14900K (476W max) | 85.06 | 35.08 |
| Intel Ultra 5 245K (286W max) | 61.05 | 26.88 |
| Intel Ultra 9 285K (362W max) | 97.17 | 38.44 |
While Cinebench is meant to reflect a 3D modelling and animation task in Cinema 4D, our Cinebench test reflects a real use case for us: transcoding a Patreon video file into H.264 and H.265 (HEVC). Here, we measured the 9950X3D sucking down a healthy 403W at full tilt, but again eclipsing the 9950X by a decent 3.6 percent margin in the h.264 encode and 2.3 percent in the HEVC encode. It’s important to note that the 403W figure is a momentary power draw near the start of the test, with 300W-355W being a more typical figure for the bulk of the run.
This is around 11 percent faster than the 7950X, for context, and a similar margin ahead of the Intel Core Ultra 285K. We do plan to retest the 245K and 285K soon to see if Intel’s promised performance upgrades have finally arrived, though reports from other outlets don’t paint a particularly rosy picture.
Now let’s get into the turkey and Yorkshire puddings of our testing, the gaming benchmarks. We have 11 games in all, plus a look at power usage.
AMD Ryzen 7 9950X3D analysis
- Introduction, test rig and content creation benchmarks
- Gaming benchmarks: Dragon’s Dogma 2, Baldur’s Gate 3, Starfield
- Gaming benchmarks: Flight Simulator 2020, F1 24, Forza Horizon 5
- Gaming benchmarks: Counter-Strike 2, Cyberpunk 2077, Crysis 3 Remastered
- Gaming benchmarks: Far Cry 6, Hitman World of Assassination
- Power analysis: Counter-Strike 2, Far Cry 6, Forza Horizon 5
- AMD Ryzen 9 9950X3D: the Digital Foundry verdict